Sumo Logic
Currently, this feature is behind the feature flag SRM_SUMO. Contact Harness Support to enable the feature.
Harness Continuous Verification (CV) integrates with Sumo Logic to:
- Verify that the deployed service is running safely and perform automatic rollbacks.
- Apply machine learning to every deployment to identify and flag anomalies with the new version.
This topic describes how to set up a Sumo Logic health source when adding a CV step to your Continuous Deployment (CD).
If you are using an aggregation operator in your Sumo Logic metrics query, then you must include the service instance identifier dimension.
Prerequisite
Sumo Logic is added as a verification provider in Harness.
Set up continuous verification
To set up CV, you need to configure a Service Reliability Management (SRM)-monitored service. A monitored service is a mapping of a Harness service to a service that is being monitored by your Application Performance Monitoring (APM) or logging tool.
Add Verify Step
To add a Verify step to your pipeline, use one of the following methods:
While building a deployment stage
If you're building a deployment stage and currently on the Execution Strategies page:
- Select the Enable Verification option.
The Verify step gets added to the pipeline. - Select the Verify step.
The Verify settings page appears.
To an existing deployment stage
If you already have a deployment stage:
Select the stage where you want to add the Verify step.
On the stage settings pane, select the Execution tab.
On the pipeline, hover over where you want the Verify step, select the + icon, and then choose Add Step.
The Step Library page appears. You can add a step at various points in the pipeline such as the beginning, end, in between existing steps, or below an existing step. Simply choose the location where you want to add the step and follow the prompts to add it.In the Continuous Verification section, select Verify.
The Verify settings page appears.
Define name and time out information
In Name, enter a name for the Verification step.
In Timeout, enter a timeout value for the step. Harness uses this information to time out the verification. Use the following syntax to define timeout:
- w for weeks. For example, to define one week, enter 1w.
- d for days. For example, to define 7 days, enter 7d.
- h for hours. For example, to define 24 hours, enter 24h.
- m for minutes, For example, to define 100 minutes, enter 100m.
- s for seconds. For example, to define 500 seconds, enter 500s.
- ms for milliseconds. For example, to define 1000 milliseconds, enter 1000ms.
The maximum timeout value you can set is 53w. You can also set timeouts at the pipeline level.
Node filtering
Currently, this feature is behind the feature flag CV_UI_DISPLAY_NODE_REGEX_FILTER. Contact Harness Support to enable the feature.
The node filtering feature allows you to select specific nodes within your Kubernetes environment using the PodName label. This allows for focused analysis, enabling you to choose specific nodes as service instances for in-depth analysis.
Harness CV autonomously identifies new nodes as they are added to the cluster. However, the node filtering feature allows you to focus the analysis explicitly on the nodes that you want to analyze. Imagine you have a Kubernetes cluster with multiple nodes, and you want to analyze the performance of pods running on specific nodes. You want to analyze the nodes that match a certain naming pattern.
Procedure:
On the Verify settings page, expand Optional to navigate to the node filtering settings section.
(Optional) Select Use node details from CD if you want Harness CV to collect and analyze the metrics and log details for the recently deployed nodes.
Specify the Control Nodes and Test Nodes:
Control Nodes: These are the nodes against which the test nodes are compared. You can specify the control nodes to provide a baseline for analysis.
Test Nodes: These are the nodes that Harness CV evaluates and compares against the control nodes.
To specify the Control Nodes and Test Nodes, in one of the following ways:
- Type node names: Enter the names of specific nodes you want to include in the analysis.
- Use simple patterns (Regex): Define a regular expression pattern to match the nodes you want to filter. For example, if your nodes follow a naming convention such as "node-app-1", "node-app-2", and so on, you could use a pattern such as "node-app-*" to include all nodes with names starting with "node-app-".
Example: Let's say you want Harness CV to analyze the only nodes that have "backend" in their PodName label:
In the Control Nodes field, enter "backend-control-node" as the control node.
In the Test Nodes field, enter the pattern "backend-*" to include all nodes with names starting with "backend-".
Select a continuous verification type, sensitivity, and duration
In Continuous Verification Type, select a type that matches your deployment strategy. The following options are available:
- Auto: Harness automatically selects the best continuous verification type based on the deployment strategy.
- Rolling Update: A rolling deployment is a deployment technique that gradually replaces old versions of a service with a new version by replacing the infrastructure on which the service runs. Rolling updates are useful in situations where a sudden changeover might cause downtime or errors.
- Canary: Canary deployment involves a two-phased deployment. In phase one, new pods and instances with the new service version are added to a single environment. In phase two, a rolling update is performed in the same environment. Canary deployment helps to detect issues with the new deployment before fully deploying it.
- Blue Green: Blue-green deployment is a technique used to deploy services to a production environment by gradually shifting user traffic from an old version to a new one. The previous version is referred to as the blue environment, while the new version is known as the green environment. Upon completion of the transfer, the blue environment remains on standby in case of a need for rollback or can be removed from production and updated to serve as the template for future updates.
- Load Test: Load testing is a strategy used in lower-level environments, such as quality assurance, where a consistent load is absent and deployment validation is typically accomplished through the execution of load-generating scripts. This is useful to ensure that the application can handle the expected load and validate that the deployment is working as expected before releasing it to the production environment.
In Sensitivity, choose the sensitivity level. The available options are High, Medium, and Low. When the sensitivity is set to high, even minor anomalies are treated as verification failures. When the sensitivity is set to High, any anomaly, no matter how small, will be treated as a verification failure. This ensures that even the slightest issue is detected and addressed before releasing the deployment to production.
In Duration, choose a duration. Harness will use the data points within this duration for analysis. For instance, if you select 10 minutes, Harness will analyze the first 10 minutes of your log or APM data. It is recommended to choose 10 minutes for logging providers and 15 minutes for APM and infrastructure providers. This helps you thoroughly analyze and detect issues before releasing the deployment to production.
In the Artifact Tag field, reference the primary artifact that you added in the Artifacts section of the Service tab. Use the Harness expression
<+serviceConfig.artifacts.primary.tag>to reference this primary artifact. To learn about artifact expression, go to Harness expression.Select Fail On No Analysis if you want the pipeline to fail if there is no data from the health source. This ensures that the deployment fails when there is no data for Harness to analyze.
Create a monitored service
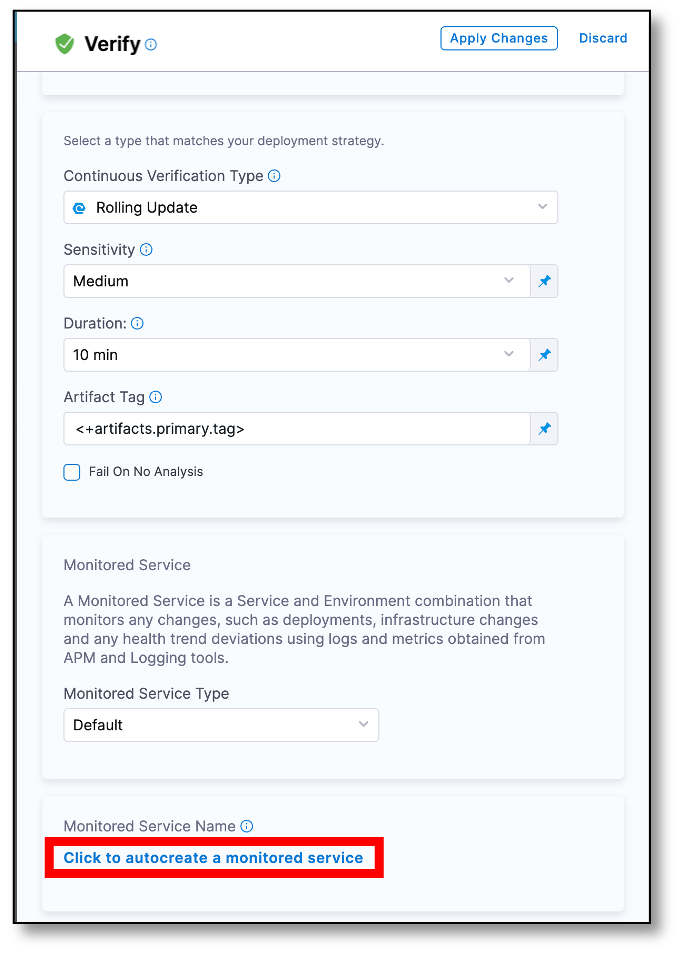
In Monitored Service, select Click to autocreate a monitored service.
Harness automatically generates a monitored service name by combining the service and environment names. The generated name appears in the Monitored Service Name field. Note that you cannot edit the monitored service name.
If a monitored service with the same name and environment already exists, the Click to autocreate a monitored service option is hidden and the existing monitored service is assigned to the Verify step by Harness.
If you've set up a service or environment as runtime values, the auto-create option for monitored services won't be available. When you run the pipeline, Harness combines the service and environment values to create a monitored service. If a monitored service with the same name already exists, it will be assigned to the pipeline. If not, Harness skips the Verification step.
For instance, if you input the service as todolist and the environment as dev, Harness creates a monitored service with the name todolist_dev. If a monitored service with that name exists, Harness assigns it to the pipeline. If not, Harness skips the Verification step.
Add a health source
A health source is an APM or logging tool that monitors and aggregates data in your deployment environment.
Define health source
To add a health source:
- In the Health Sources section, select + Add. The Add New Health Source dialog appears.
- On the Define Health Source tab, do the following:
- In the Define Health Source section, select SumoLogic as health source type.
- In the Health Source Name field, enter a name for the health source.
- In the Connect Health Source section, select the Select Connector.
The Create or Select an Existing Connector dialog appears. - Select a connector for the Sumo Logic health source and then select Apply Selected.
The selected connector appears in the Select Connector dropdown field. - In the Select Feature, you can either select SumoLogic Cloud Metrics or SumoLogic Cloud Logs.
- Select Next.
The Configuration tab appears.
Define metric and log configuration settings
Perform the following steps based on the feature you have selected in the Select Feature field.
- Steps to configure SumoLogic Cloud Metrics
- Steps to configure SumoLogic Cloud Logs
- On the Configuration tab, select + Add Metric.
The Add Metric dialog appears. - Enter the following information and then select Submit:
- Metric name: Enter a name for the metric. For example, Memory Metric.
- Group name: If the group to which you want to add the metric already exists, select it.
If you want to create a new group, select + Add New. In the Add Group Name dialog enter a group name, and then select Submit.
- In the Add Metric dialog, select Submit.
New group and metric are created. The query specifications and mapping settings are displayed. These settings help you get the desired metric data from the Sumo Logic platform and map it to Harness service. To learn about Sumo Logic metrics and queries, go to https://help.sumologic.com/docs/metrics/.
Define a query
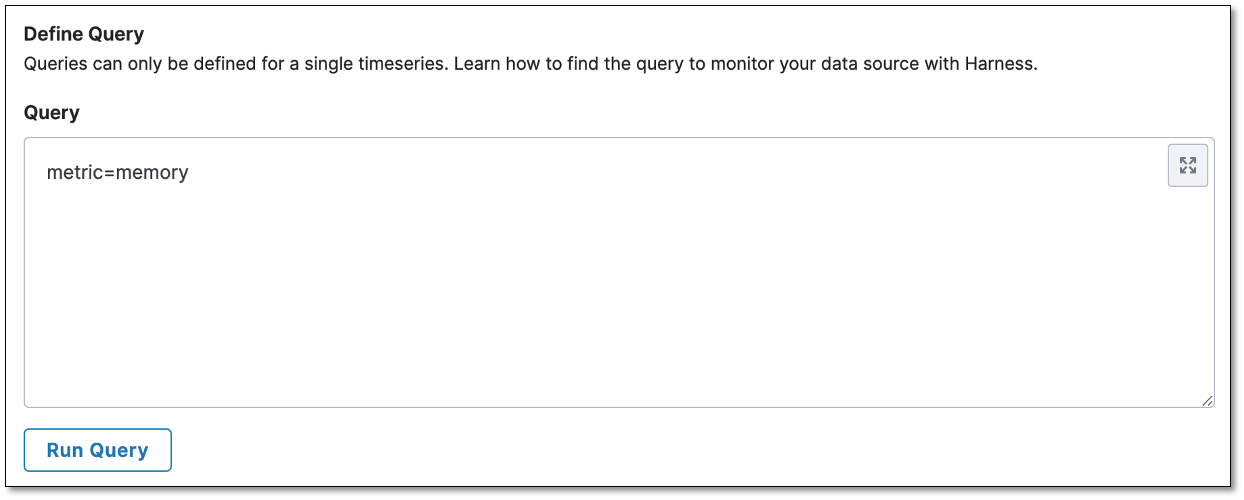
In the Query box, enter your metric query and then select Run Query.
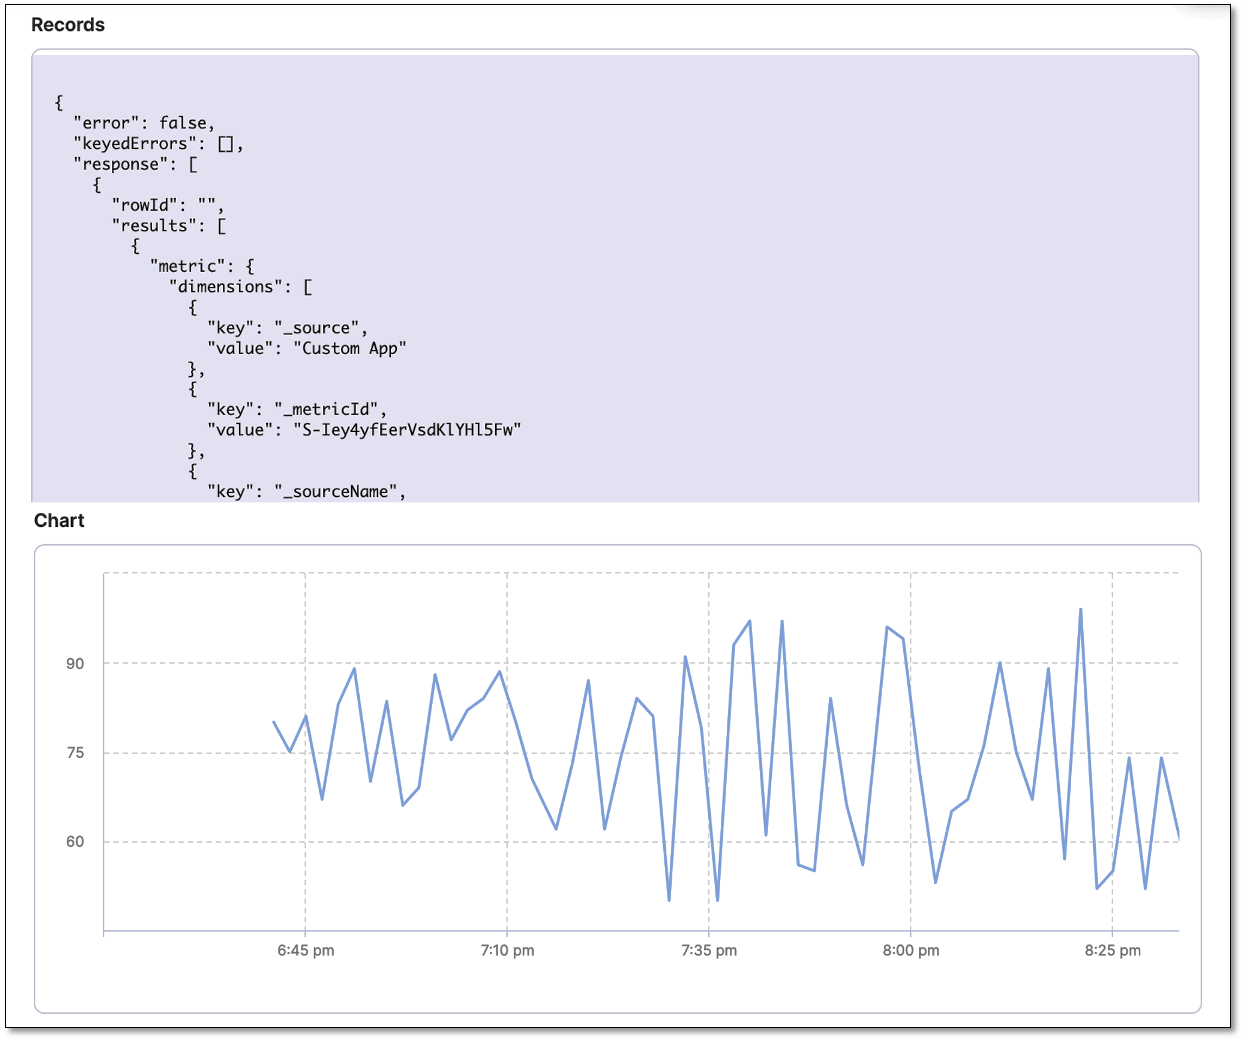
Sample data is displayed in the Records box. The Chart box displays the graph corresponding to the sample data. This helps you verify if the query that you have built is correct.
Sample query for memory usage
Query: metric=memory
Disk usage records and chart being displayed for the query
Assign services
In the Assign section, select the services to which you want to apply the Sumo Logic metric. Following options are available:
- Continuous Verification (Applied to the pipelines in the Continuous Deployment): Select this option to use the metric data in the Continuous Deployment pipeline to ensure that the deployed service is running safely and to perform automatic rollbacks. In addition, the metric will be used to apply machine learning in detecting and highlighting future deployment issues.
- Service Health: Select this option to use the metric data to track the changes in the health trend of your monitored service.
- Service Level Indicator (SLI): Select this option to use the metric data to measure the SLI and obtain the performance of the service.
Configure risk profile
If you select Continuous Verification (Applied to the pipelines in the Continuous Deployment) or Service Health, expand the section below and follow the instructions for configuring the risk profile.
Risk Profile settings
Risk Profile
The Risk Profile section is only visible if you have selected Continuous Verification (Applied to the pipelines in the Continuous Deployment) or Service Health in the Assign section.
- Under Risk Category, select one of the following options:
- Errors
- Infrastructure
- Performance/Throughput
- Performance/Other
- Performance/Response Time
- Under Deviation Compared To Baseline, select the following settings to measure your service's behavior and calculate deviations from the health source:
Higher counts = higher risk
Lower counts = higher risk
Note that you can select multiple options.
Map service instance identifier
The Map service instance identifier section is only visible if you have selected Continuous Verification (Applied to the pipelines in the Continuous Deployment) in the Assign section.
In Service Instance Identifier (only needed for CV), specify the service instance identifier, which represents a dynamically created service that you deploy using Harness. The default value is _sourceHost.
Advanced (Optional)
The Advanced (Optional) section is only visible if you have selected Continuous Verification (Applied to the pipelines in the Continuous Deployment) in the Assign section.
Ignore Thresholds
You can select the types of events for which you want to set thresholds in CV. Metrics that match the selected rules will not be flagged as anomalous, regardless of the analysis.
To set the Ignore Thresholds for CV:
- Go to the Ignore Thresholds tab and select the + Add Threshold button.
- From the Metric dropdown, select the desired metric for which you want to set the rule.
- In the Criteria field, choose the type of criteria you want to apply for the threshold:
- Absolute Value: Select this option and enter the Greater than and Lesser than values.
- Percentage Deviation: Select this option and enter the Lesser than value.
Fail-Fast Thresholds
You can select the type of events for which you want to set thresholds in CV. Any metric that matches the selected rules will be marked as anomalous and cause the Workflow state to fail.
To set fail-fast thresholds for CV, follow these steps:
- Go to the Fail-Fast Thresholds tab and select the + Add Threshold button.
- From the Metric dropdown, select the desired metric for which you want to set the rule.
- In the Action field, select what the CV should do when applying the rule:
- Fail Immediately
- Fail after multiple occurrences
- Fail after consecutive occurrences
- In the Count field, set the number of occurrences. This setting is only visible if you have selected Fail after multiple occurrences or Fail after consecutive occurrences in the Action field. The minimum value must be two.
- In the Criteria field, choose the type of criteria you want to apply for the threshold:
- Absolute Value: Select this option and enter the Greater than and Lesser than values.
- Percentage Deviation: Select this option and enter the Lesser than value.
- On the Configuration tab, select + Add Query.
The Add Query dialog appears. - Enter a name for the query and then select Submit.
The Custom Queries settings are displayed. These settings assist in retrieving the desired logs from the Sumo Logic platform and mapping them to the Harness service. To learn about Sumo Logic logs, go to https://help.sumologic.com/docs/search/.
Define a query
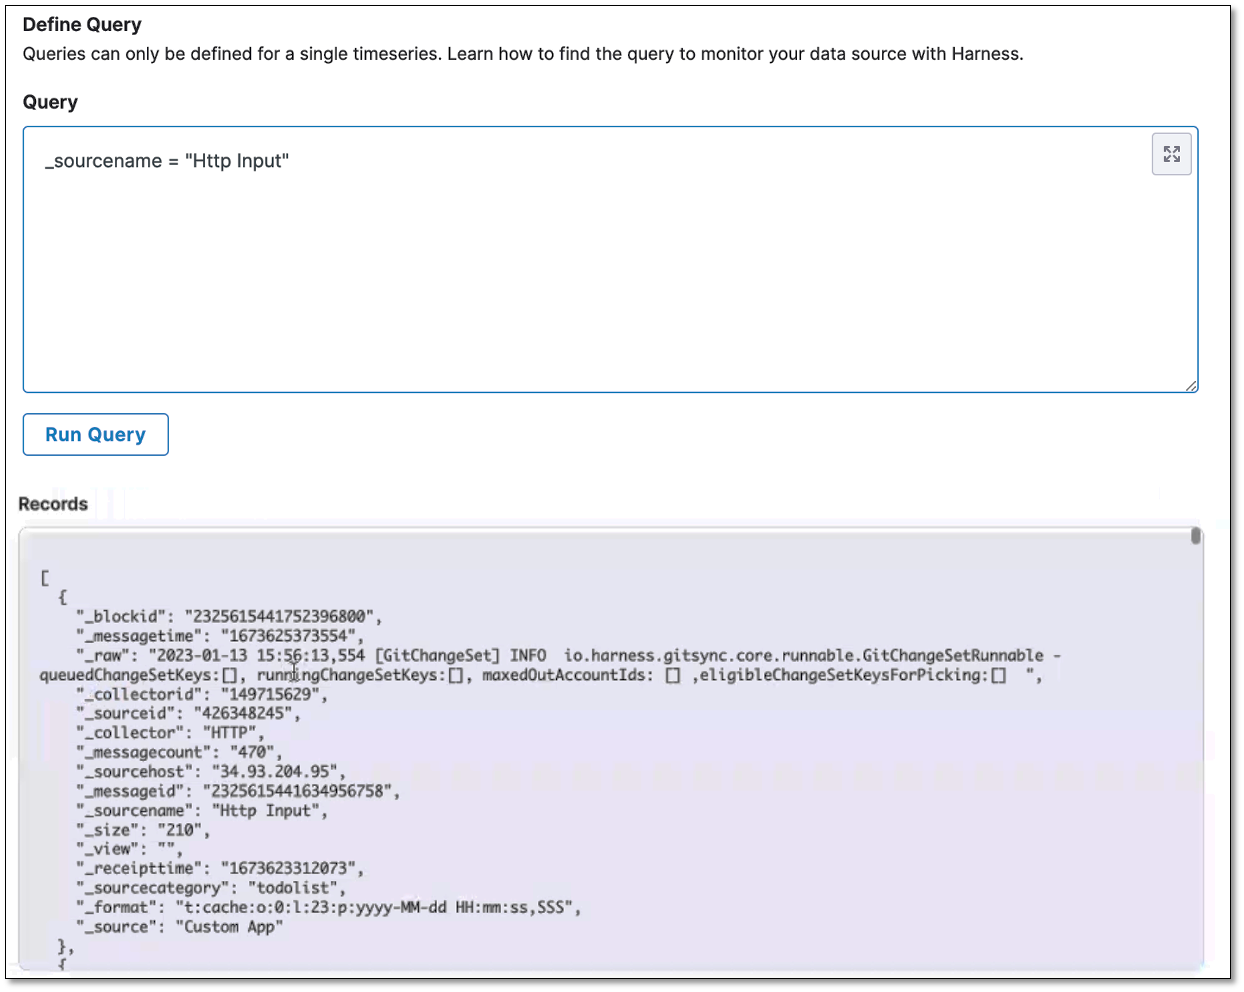
- In the Query field, enter the log query and select Run Query to execute it. This displays a sample record in the Records field, allowing you to confirm the accuracy of the query you've constructed. For the verification process to be effective, the query should be designed to accurately extract error logs specific to the service.```
- In the Field Mapping section, select the Service Instance Identifier to display the logs, and then select Get sample log messages. Sample logs are displayed which include a timestamp, the host where the log was recorded, and the log message itself. These three properties are critical for accurate verification, so it's important to check their accuracy. If the host information doesn't match the actual instance of your service, you should review the mapping provided for the Service Instance Identifier.
Sample log query
Query: _sourcename = "Http Input"
Save the health source settings
- After configuring all the settings, select Submit to add the health source to the Verify step.
- Select Apply Changes to save the changes made to the Verify step.
Run the pipeline
To run the pipeline:
- In the upper-right corner, select Run.
The Run Pipeline dialog box appears. - In the dialog box, do the following:
- Tag: If you did not add a tag in the Artifact Details settings, select it now.
- Skip preflight check: Select this option if you want to skip the preflight check.
- Notify only me about execution status: Select this option if you want Harness to alert only you about the execution status.
- Select Run Pipeline.
The pipeline starts running.
View results
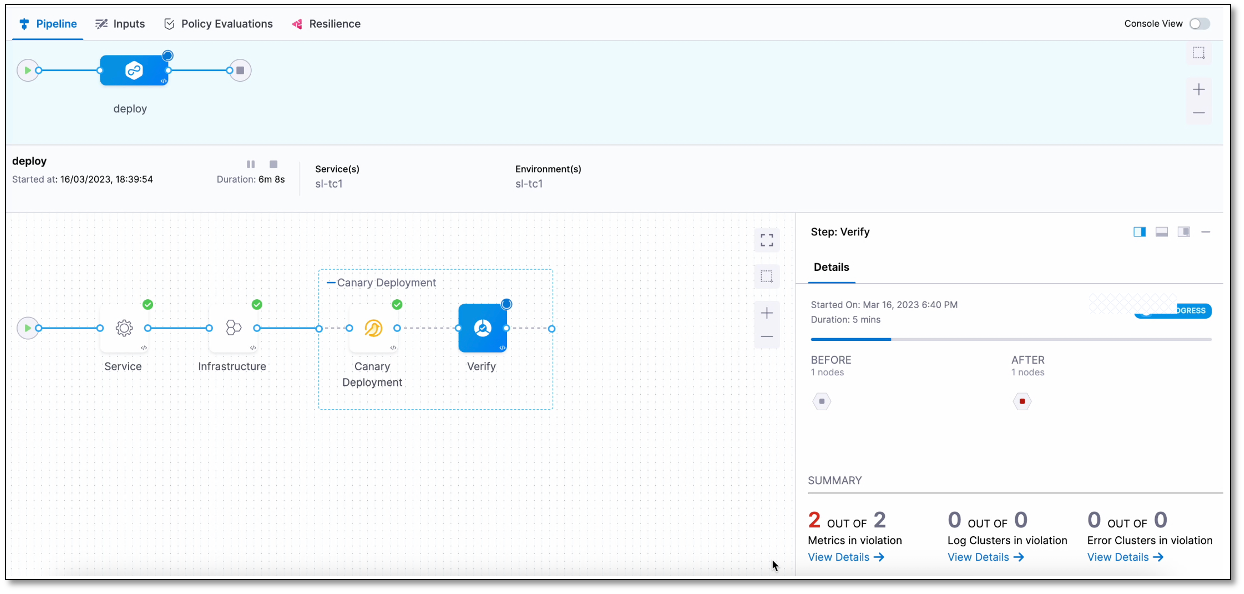
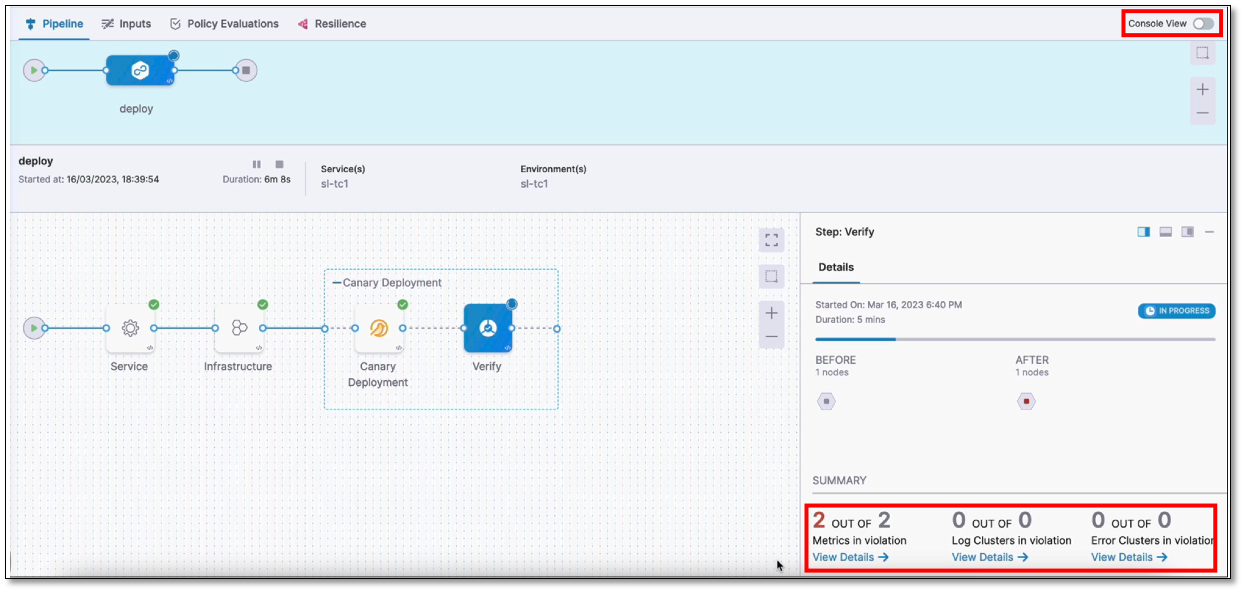
The Summary section displays the following details when the Verify step begins:
- Metrics in violation
- Log Clusters in violation
- Error Clusters in violation
Note that it may take some time for the analysis to begin. The screenshot below shows a Verification step running in a deployment:
Console view
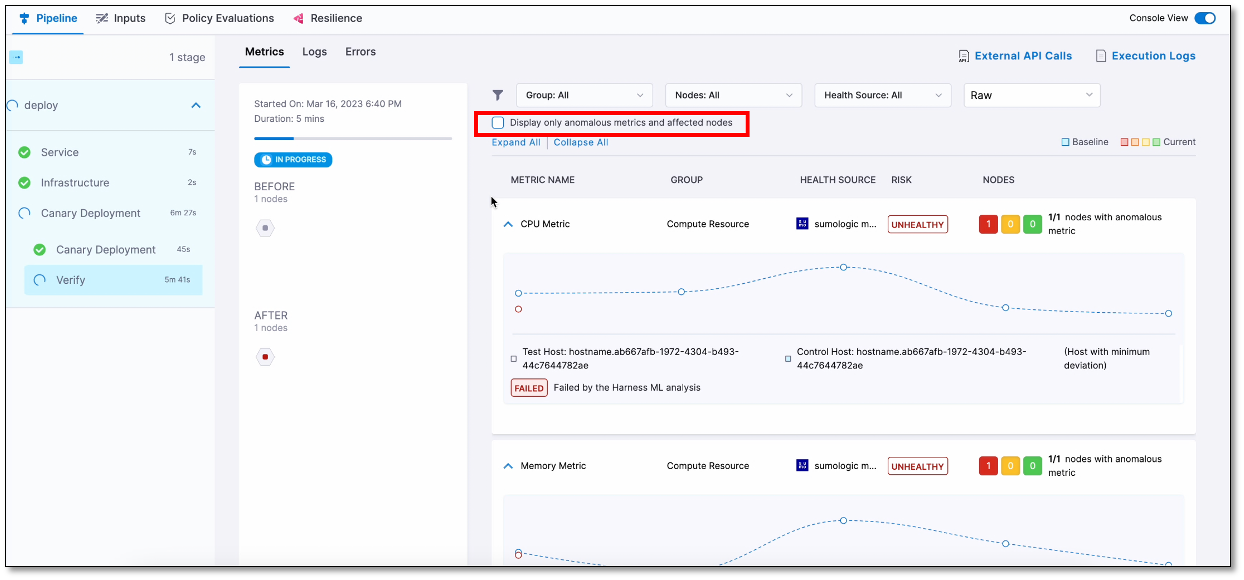
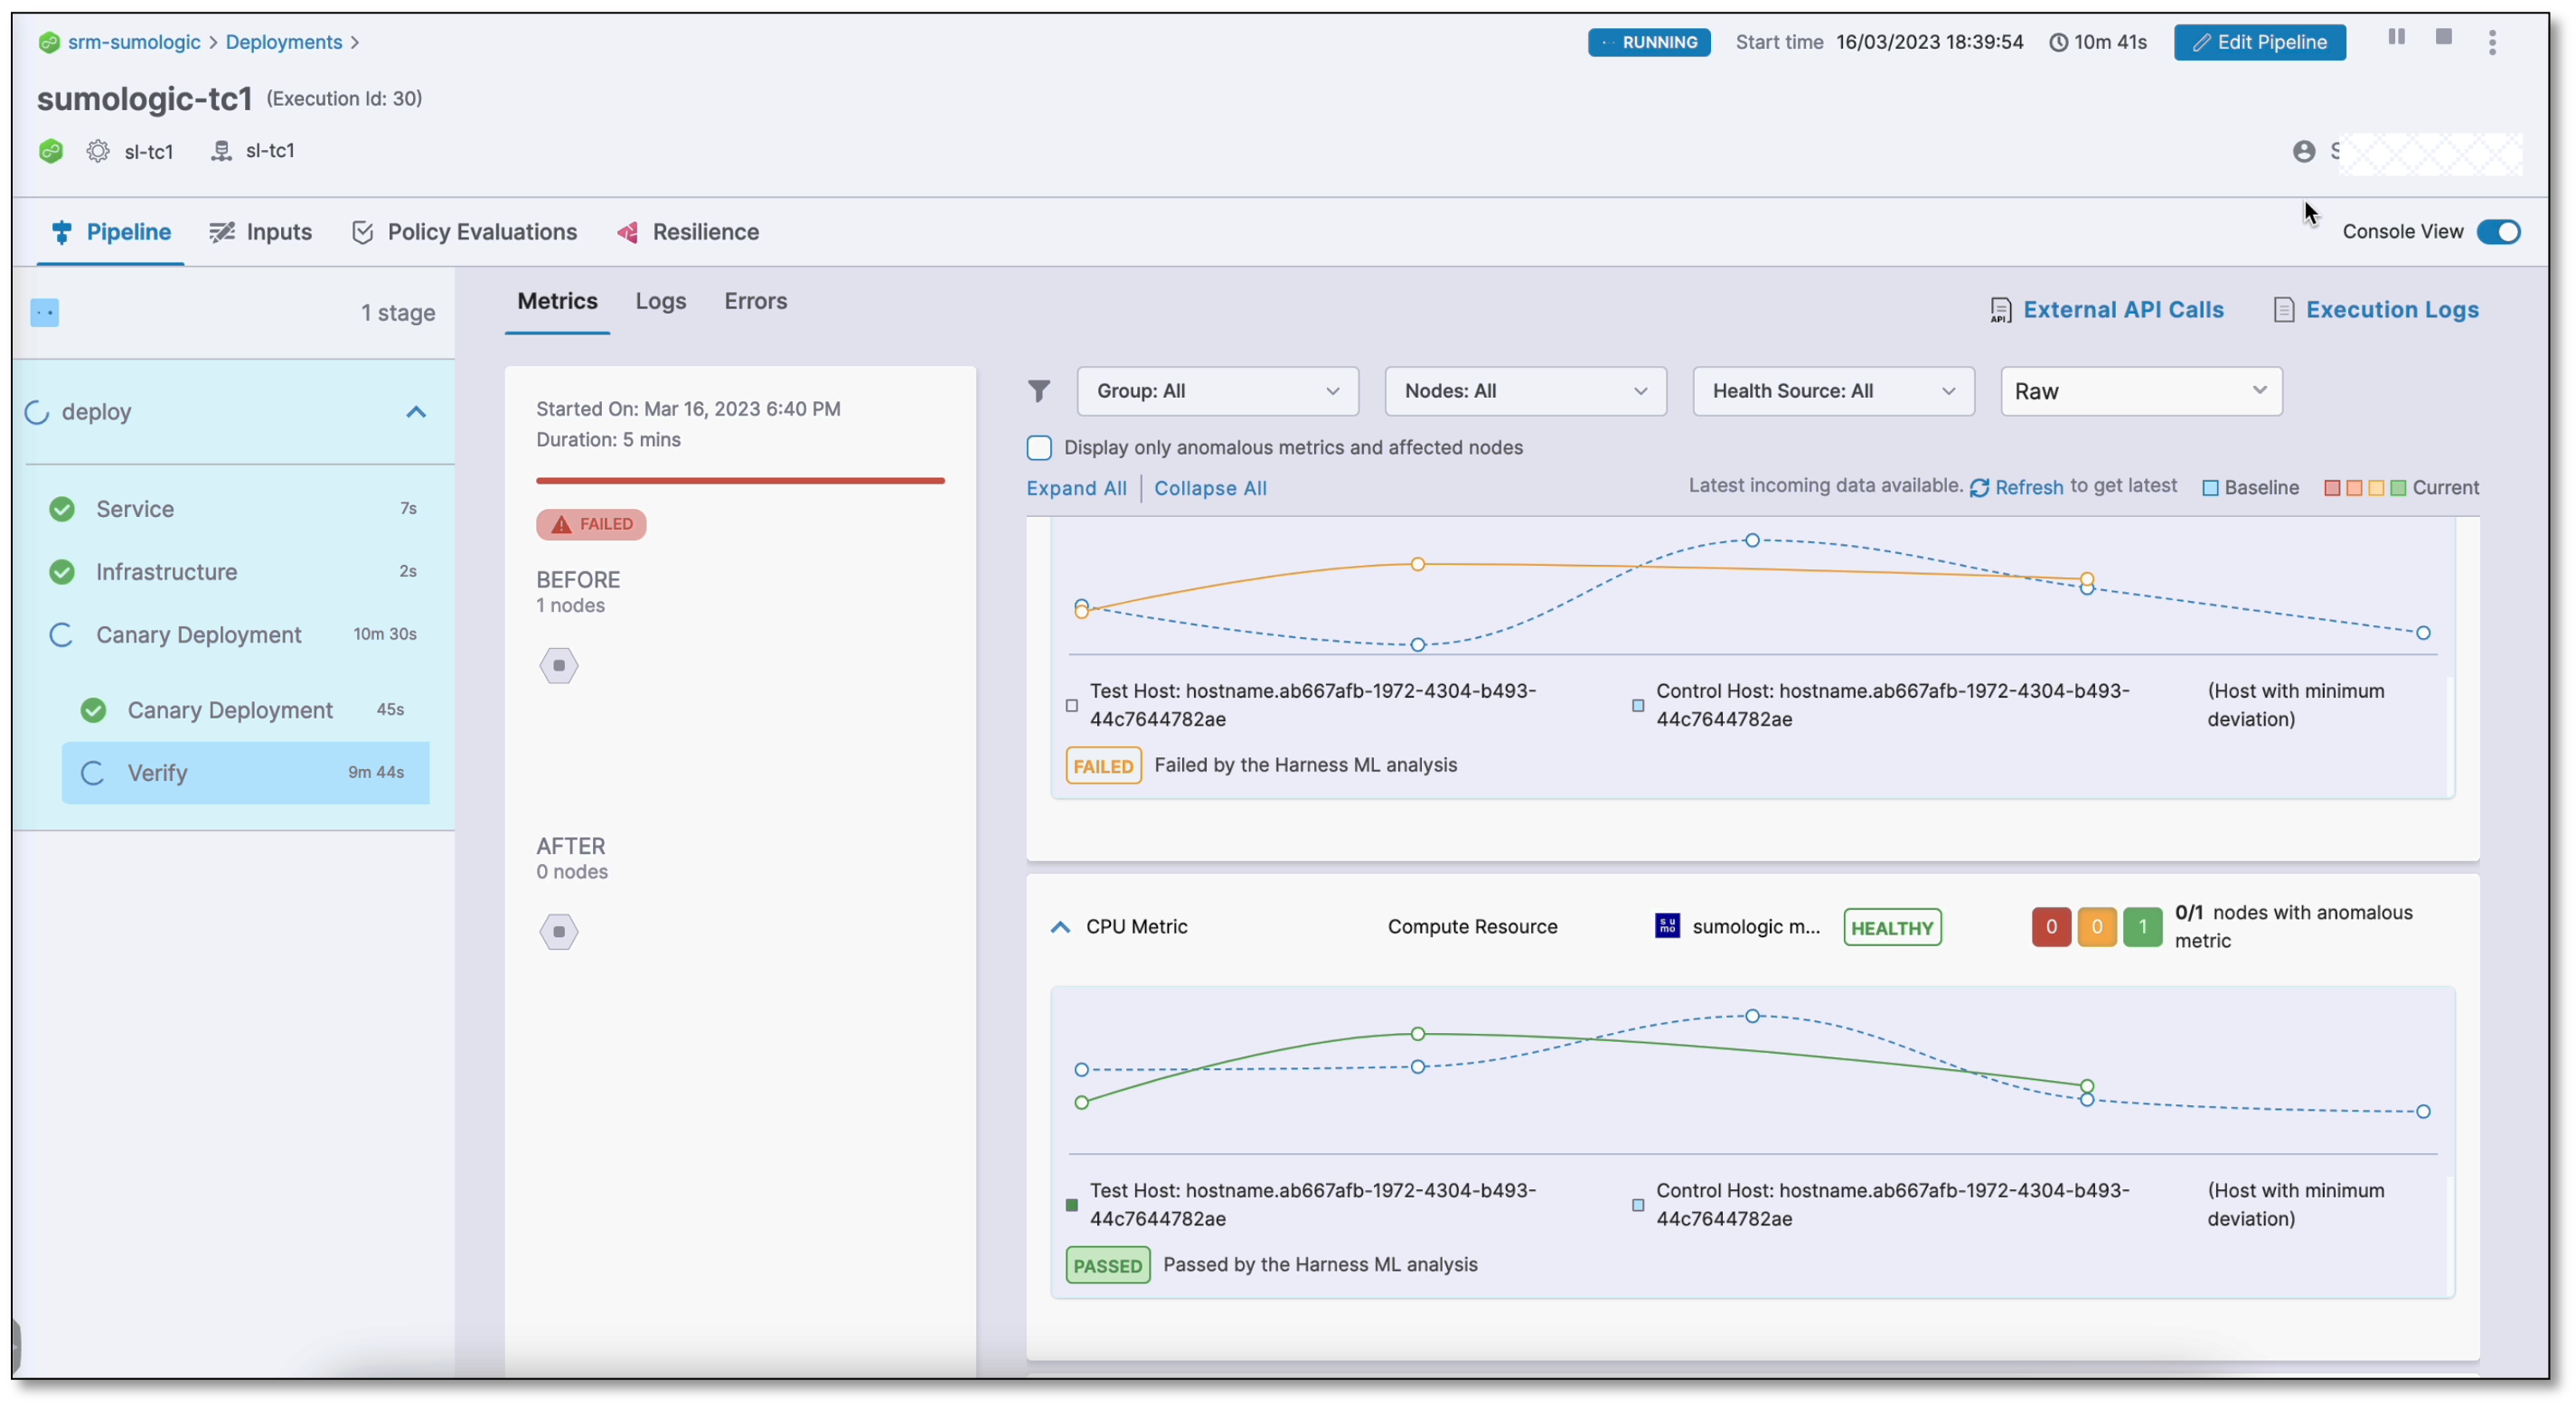
The console view displays detailed logs of the pipeline, including verification logs. To view the console, select View Details in the Summary section or turn on the Console View toggle switch in the upper-right corner.
By default, the console displays logs of only the anomalous metrics and affected nodes. To see all logs, clear the Display only anomalous metrics and affected nodes check box.
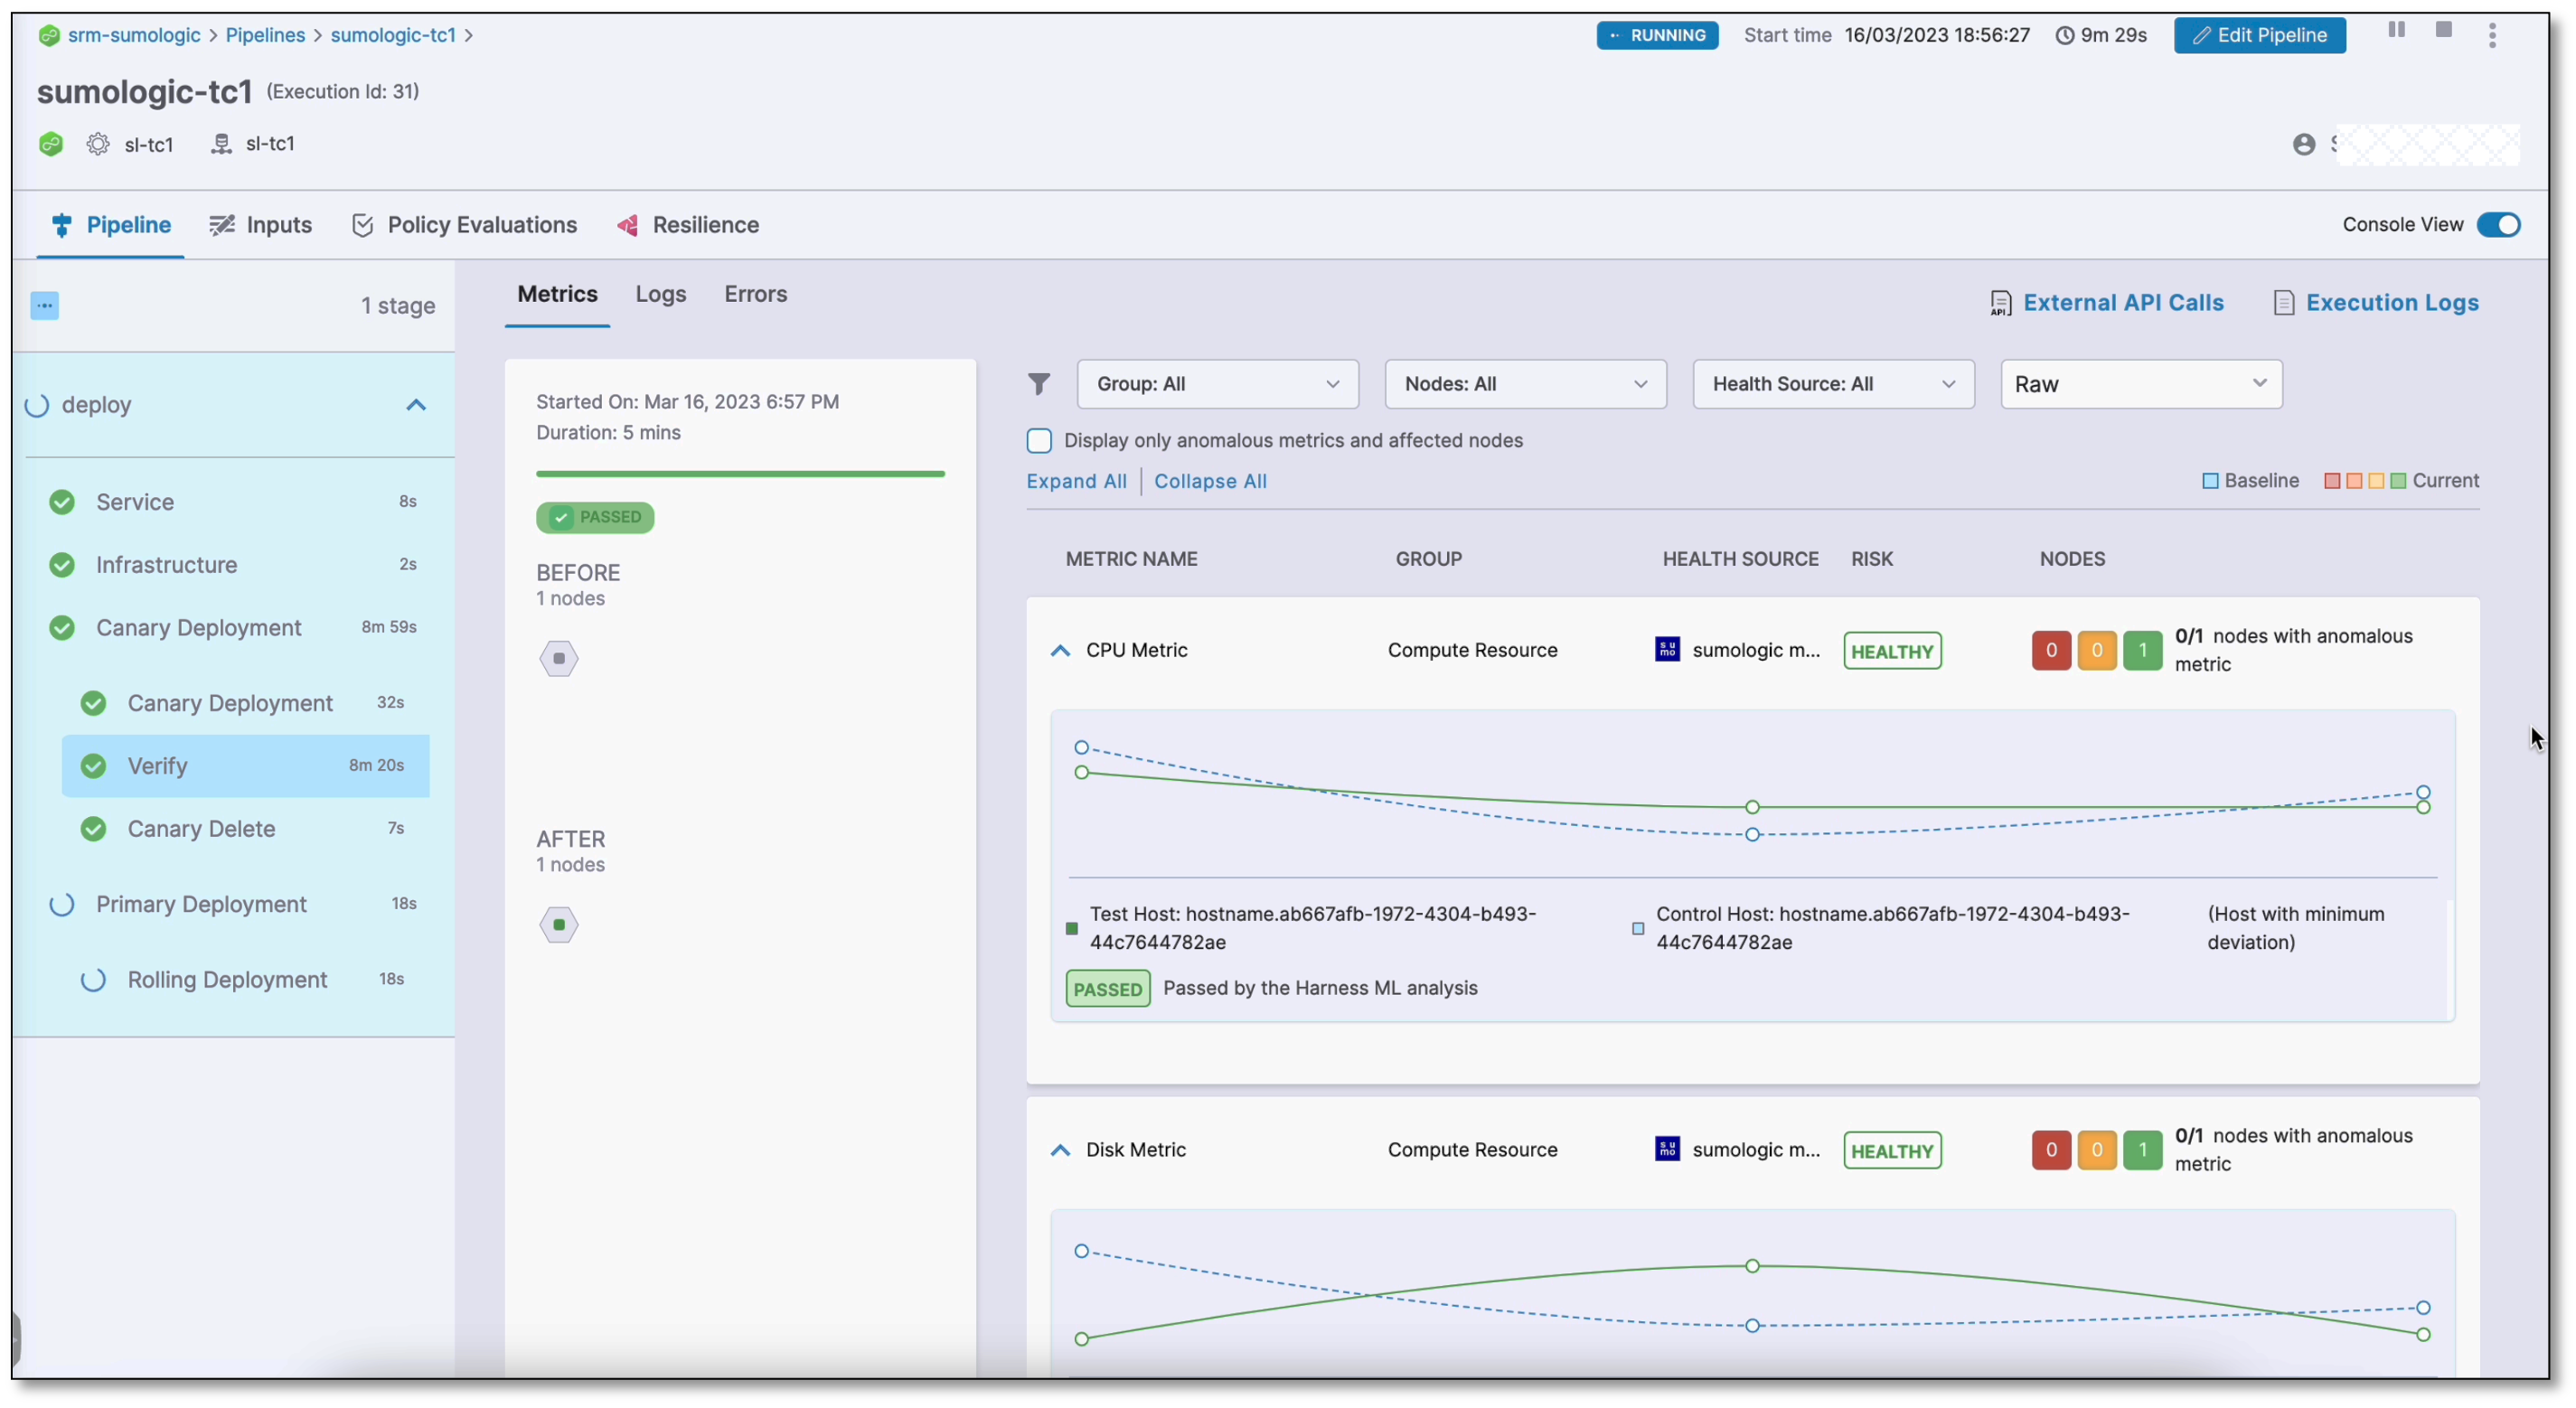
The following screenshots show successful and failed verifications in a deployment run:
Successful verification
Failed verification
Set a pinned baseline
Currently, this feature is behind the feature flag SRM_ENABLE_BASELINE_BASED_VERIFICATION. Contact Harness Support to enable the feature.
You can set specific verification in a successful pipeline execution as a baseline. This is available with Load Testing as the verification type.
Set successful verification as a baseline
To set a verification as baseline for future verifications:
In Harness, go to Deployments, select Pipelines, and find the pipeline you want to use as the baseline.
Select the successful pipeline execution with the verification that you want to use as the baseline.
The pipeline execution is displayed.
On the pipeline execution, navigate to the Verify section, and then select Pin baseline.
The selected verification is now set as the baseline for future verifications.
Replace an existing pinned baseline
To use a new baseline from a pipeline and replace the existing pinned baseline, follow these steps:
In Harness, go to Deployments, select Pipelines, and find the pipeline from which you want to remove the baseline.
Select the successful pipeline execution with the verification that you have previously pinned as the baseline.
On the pipeline execution, navigate to the Verify section, and then select Pin baseline.
A confirmation alert message appears, asking if you want to replace the existing pinned baseline with the current verification. After you confirm, the existing pinned baseline gets replaced with the current verification.